College Football Preseason Predictions For 2017
August 23, 2017 – by David Hess
Below are our official 2017 college football preseason predictions and projected standings.
After the standings tables, you’ll find some tips on how to interpret the numbers.
During the season, we update these predictions daily on our college football projected standings page.
Editor’s Note: If you’re in a college football pool or betting games, check out our Football Pick’em Pool Picks and College Football Betting Picks. Top rated picks went 57.4% against the spread last season.
2017 Predictions & Projected Standings:ACC | Big Ten | Big 12 | Pac-12 | SECAll other conferences
Additional Info:How do we come up with these predictions?Exactly what do these numbers mean?Why does our approach make sense?
ACC Preseason Predictions 2017
| ACC | Conference | Overall | Playoffs | ||||
|---|---|---|---|---|---|---|---|
| Atlantic | W | L | W | L | Bowl Eligible | Win Conf | Undef |
| Florida St | 6.5 | 1.5 | 9.6 | 2.4 | 95.5% | 29.4% | 8.9% |
| Louisville | 5.9 | 2.1 | 9.5 | 2.5 | 95.8% | 15.5% | 8.1% |
| Clemson | 5.8 | 2.2 | 9.3 | 2.7 | 93.7% | 17.4% | 7.8% |
| NC State | 4.2 | 3.8 | 7.2 | 4.8 | 75.1% | 4.4% | 1.6% |
| Syracuse | 2.3 | 5.7 | 5.0 | 7.0 | 43.0% | 0.7% | 0.1% |
| Wake Forest | 2.3 | 5.7 | 4.6 | 7.4 | 37.5% | 1.1% | 0.1% |
| Boston Col | 2.2 | 5.8 | 4.5 | 7.5 | 37.2% | 0.4% | 0.1% |
| Coastal | W | L | W | L | Bowl Eligible | Win Conf | Undef |
| Miami (FL) | 5.0 | 3.0 | 8.3 | 3.7 | 84.6% | 9.4% | 3.5% |
| GA Tech | 4.7 | 3.3 | 7.4 | 4.6 | 74.4% | 6.7% | 2.2% |
| VA Tech | 4.5 | 3.5 | 7.8 | 4.2 | 79.5% | 5.5% | 2.7% |
| Pittsburgh | 4.0 | 4.0 | 6.4 | 5.6 | 64.4% | 4.0% | 0.9% |
| Duke | 3.4 | 4.6 | 6.0 | 6.0 | 57.8% | 2.5% | 0.9% |
| N Carolina | 3.2 | 4.8 | 6.2 | 5.8 | 61.5% | 2.5% | 0.9% |
| Virginia | 2.1 | 5.9 | 4.5 | 7.5 | 36.0% | 0.5% | 0.1% |
Big 12 Preseason Predictions 2017
| Big 12 | Conference | Overall | Playoffs | ||||
|---|---|---|---|---|---|---|---|
| Team | W | L | W | L | Bowl Eligible | Win Conf | Undef |
| Oklahoma | 7.4 | 1.6 | 9.7 | 2.3 | 96.6% | 38.0% | 8.8% |
| Oklahoma St | 6.2 | 2.8 | 8.7 | 3.3 | 87.4% | 16.8% | 5.6% |
| Kansas St | 6.0 | 3.0 | 8.6 | 3.4 | 89.5% | 14.7% | 4.6% |
| TX Christian | 5.5 | 3.5 | 7.9 | 4.1 | 83.4% | 10.6% | 2.4% |
| Texas | 5.1 | 3.9 | 7.2 | 4.8 | 74.6% | 8.1% | 1.5% |
| W Virginia | 4.4 | 4.6 | 6.7 | 5.3 | 69.4% | 4.6% | 0.9% |
| Baylor | 4.4 | 4.6 | 6.7 | 5.3 | 69.6% | 4.8% | 1.0% |
| Texas Tech | 3.0 | 6.0 | 4.8 | 7.2 | 39.7% | 1.7% | 0.2% |
| Iowa State | 2.4 | 6.6 | 4.4 | 7.6 | 34.6% | 0.7% | 0.1% |
| Kansas | 0.7 | 8.3 | 2.4 | 9.6 | 8.1% | 0.0% | 0.0% |
Big Ten Preseason Predictions 2017
| Big Ten | Conference | Overall | Playoffs | ||||
|---|---|---|---|---|---|---|---|
| East | W | L | W | L | Bowl Eligible | Win Conf | Undef |
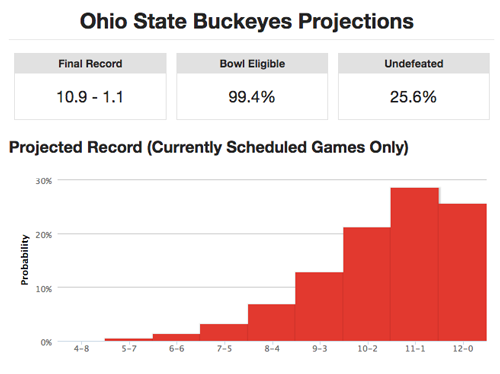
| Ohio State | 8.1 | 0.9 | 10.9 | 1.1 | 99.3% | 40.9% | 26.0% |
| Penn State | 6.7 | 2.3 | 9.6 | 2.4 | 95.8% | 13.0% | 7.5% |
| Michigan | 6.4 | 2.6 | 9.0 | 3.0 | 92.4% | 13.1% | 5.7% |
| Indiana | 3.8 | 5.2 | 6.1 | 5.9 | 59.3% | 1.2% | 0.4% |
| Michigan St | 3.4 | 5.6 | 5.2 | 6.8 | 46.5% | 0.8% | 0.2% |
| Maryland | 2.5 | 6.5 | 4.2 | 7.8 | 30.5% | 0.1% | 0.0% |
| Rutgers | 1.7 | 7.3 | 3.3 | 8.7 | 16.9% | 0.0% | 0.0% |
| West | W | L | W | L | Bowl Eligible | Win Conf | Undef |
| Wisconsin | 7.3 | 1.7 | 10.0 | 2.0 | 95.4% | 18.2% | 13.9% |
| Northwestern | 5.7 | 3.3 | 8.2 | 3.8 | 83.2% | 5.3% | 3.2% |
| Minnesota | 4.7 | 4.3 | 7.0 | 5.0 | 71.9% | 2.4% | 1.1% |
| Iowa | 4.7 | 4.3 | 7.2 | 4.8 | 75.6% | 3.5% | 1.4% |
| Nebraska | 3.7 | 5.3 | 5.4 | 6.6 | 49.1% | 1.1% | 0.2% |
| Purdue | 2.1 | 6.9 | 2.9 | 9.1 | 15.3% | 0.1% | 0.0% |
| Illinois | 2.1 | 6.9 | 2.9 | 9.1 | 16.9% | 0.2% | 0.0% |
Pac-12 Preseason Predictions 2017
| Pac-12 | Conference | Overall | Playoffs | ||||
|---|---|---|---|---|---|---|---|
| North | W | L | W | L | Bowl Eligible | Win Conf | Undef |
| Washington | 7.1 | 1.9 | 10.0 | 2.0 | 96.7% | 22.7% | 13.0% |
| Stanford | 6.6 | 2.4 | 9.1 | 2.9 | 90.4% | 19.8% | 7.4% |
| Wash State | 4.9 | 4.1 | 7.6 | 4.4 | 79.4% | 7.0% | 2.3% |
| Oregon | 4.6 | 4.4 | 7.1 | 4.9 | 74.3% | 3.9% | 1.2% |
| Oregon St | 2.8 | 6.2 | 4.8 | 7.2 | 40.9% | 1.1% | 0.2% |
| California | 1.7 | 7.3 | 3.2 | 8.8 | 18.5% | 0.2% | 0.0% |
| South | W | L | W | L | Bowl Eligible | Win Conf | Undef |
| USC | 7.2 | 1.8 | 9.5 | 2.5 | 91.4% | 27.7% | 10.1% |
| UCLA | 4.4 | 4.6 | 6.4 | 5.6 | 62.9% | 4.5% | 0.8% |
| Colorado | 4.1 | 4.9 | 6.8 | 5.2 | 70.5% | 5.0% | 1.4% |
| Utah | 4.1 | 4.9 | 6.6 | 5.4 | 65.9% | 4.1% | 0.8% |
| Arizona St | 3.2 | 5.8 | 5.3 | 6.7 | 49.3% | 2.6% | 0.4% |
| Arizona | 3.2 | 5.8 | 5.5 | 6.5 | 51.9% | 1.4% | 0.4% |
SEC Preseason Predictions 2017
| SEC | Conference | Overall | Playoffs | ||||
|---|---|---|---|---|---|---|---|
| East | W | L | W | L | Bowl Eligible | Win Conf | Undef |
| Georgia | 5.0 | 3.0 | 7.7 | 4.3 | 78.3% | 7.4% | 2.6% |
| Florida | 4.7 | 3.3 | 7.4 | 4.6 | 76.3% | 6.8% | 2.1% |
| Tennessee | 3.8 | 4.2 | 7.2 | 4.8 | 76.8% | 4.5% | 1.0% |
| Missouri | 3.7 | 4.3 | 7.4 | 4.6 | 78.5% | 3.1% | 1.8% |
| Kentucky | 3.6 | 4.4 | 6.6 | 5.4 | 66.5% | 2.8% | 1.3% |
| Vanderbilt | 3.2 | 4.8 | 6.0 | 6.0 | 57.3% | 2.3% | 0.7% |
| S Carolina | 2.2 | 5.8 | 4.3 | 7.7 | 34.4% | 0.5% | 0.2% |
| West | W | L | W | L | Bowl Eligible | Win Conf | Undef |
| Alabama | 7.0 | 1.0 | 10.6 | 1.4 | 98.7% | 42.7% | 21.3% |
| Auburn | 5.3 | 2.7 | 8.7 | 3.3 | 90.5% | 14.2% | 4.7% |
| LSU | 5.0 | 3.0 | 8.7 | 3.3 | 88.7% | 9.4% | 4.3% |
| Texas A&M | 3.6 | 4.4 | 7.0 | 5.0 | 74.1% | 3.5% | 1.1% |
| Arkansas | 3.2 | 4.8 | 6.6 | 5.4 | 68.8% | 1.2% | 0.6% |
| Mississippi | 2.9 | 5.1 | 6.5 | 5.5 | 0.0% | 0.0% | 0.5% |
| Miss State | 2.7 | 5.3 | 6.0 | 6.0 | 60.4% | 1.6% | 0.5% |
Preseason Predictions For Other FBS Conferences
AAC Preseason Predictions 2017
| AAC | Conference | Overall | Playoffs | ||||
|---|---|---|---|---|---|---|---|
| East | W | L | W | L | Bowl Eligible | Win Conf | Undef |
| S Florida | 6.5 | 1.5 | 10.3 | 1.7 | 96.8% | 28.3% | 16.9% |
| Central FL | 4.3 | 3.7 | 7.0 | 5.0 | 71.2% | 7.1% | 1.5% |
| Temple | 4.0 | 4.0 | 6.4 | 5.6 | 65.2% | 5.7% | 0.9% |
| Cincinnati | 3.1 | 4.9 | 5.2 | 6.8 | 45.3% | 1.6% | 0.2% |
| E Carolina | 2.7 | 5.3 | 4.2 | 7.8 | 33.3% | 1.8% | 0.1% |
| Connecticut | 2.2 | 5.8 | 3.8 | 8.2 | 28.7% | 0.9% | 0.1% |
| West | W | L | W | L | Bowl Eligible | Win Conf | Undef |
| Memphis | 5.7 | 2.3 | 9.0 | 3.0 | 91.2% | 14.3% | 6.4% |
| Houston | 5.7 | 2.3 | 8.9 | 3.1 | 87.5% | 21.6% | 5.9% |
| Navy | 5.1 | 2.9 | 7.8 | 4.2 | 78.3% | 9.9% | 2.4% |
| Tulsa | 3.8 | 4.2 | 5.8 | 6.2 | 55.3% | 6.3% | 0.6% |
| S Methodist | 2.6 | 5.4 | 5.0 | 7.0 | 44.1% | 1.1% | 0.1% |
| Tulane | 2.5 | 5.5 | 4.5 | 7.5 | 36.1% | 1.4% | 0.0% |
Conference USA Preseason Predictions 2017
| CUSA | Conference | Overall | Playoffs | ||||
|---|---|---|---|---|---|---|---|
| East | W | L | W | L | Bowl Eligible | Win Conf | Undef |
| W Kentucky | 7.0 | 1.0 | 10.1 | 1.9 | 96.5% | 40.3% | 13.3% |
| Middle Tenn | 5.1 | 2.9 | 6.4 | 5.6 | 63.4% | 8.2% | 0.7% |
| Marshall | 4.5 | 3.5 | 6.4 | 5.6 | 62.2% | 7.8% | 0.9% |
| Old Dominion | 3.9 | 4.1 | 5.6 | 6.4 | 52.6% | 3.9% | 0.4% |
| Fla Atlantic | 3.8 | 4.2 | 5.5 | 6.5 | 50.2% | 2.6% | 0.1% |
| Florida Intl | 3.0 | 5.0 | 4.5 | 7.5 | 36.8% | 1.9% | 0.1% |
| Charlotte | 1.8 | 6.2 | 3.2 | 8.8 | 19.8% | 0.4% | 0.0% |
| West | W | L | W | L | Bowl Eligible | Win Conf | Undef |
| S Mississippi | 5.2 | 2.8 | 7.1 | 4.9 | 73.6% | 9.6% | 1.0% |
| LA Tech | 5.1 | 2.9 | 7.4 | 4.6 | 76.0% | 10.4% | 1.5% |
| TX-San Ant | 4.6 | 3.4 | 6.6 | 5.4 | 66.3% | 6.6% | 0.8% |
| Rice | 3.8 | 4.2 | 4.2 | 7.8 | 31.1% | 3.3% | 0.0% |
| UAB | 3.4 | 4.6 | 5.1 | 6.9 | 44.4% | 2.3% | 0.2% |
| North Texas | 2.9 | 5.1 | 4.2 | 7.8 | 32.5% | 1.4% | 0.1% |
| TX El Paso | 2.0 | 6.0 | 2.7 | 9.3 | 15.6% | 1.1% | 0.0% |
MAC Preseason Predictions 2017
| MAC | Conference | Overall | Playoffs | ||||
|---|---|---|---|---|---|---|---|
| East | W | L | W | L | Bowl Eligible | Win Conf | Undef |
| Ohio | 4.2 | 3.8 | 6.9 | 5.1 | 67.7% | 7.8% | 1.7% |
| Bowling Grn | 4.1 | 3.9 | 5.5 | 6.5 | 51.8% | 7.5% | 0.4% |
| Miami (OH) | 4.1 | 3.9 | 5.8 | 6.2 | 55.3% | 5.7% | 0.4% |
| Akron | 3.6 | 4.4 | 5.2 | 6.8 | 45.4% | 4.5% | 0.1% |
| Kent State | 3.1 | 4.9 | 4.3 | 7.7 | 30.7% | 2.8% | 0.0% |
| Buffalo | 1.9 | 6.1 | 3.3 | 8.7 | 23.0% | 1.0% | 0.1% |
| West | W | L | W | L | Bowl Eligible | Win Conf | Undef |
| Toledo | 6.2 | 1.8 | 8.9 | 3.1 | 88.8% | 27.8% | 5.3% |
| W Michigan | 6.2 | 1.8 | 8.6 | 3.4 | 90.3% | 22.8% | 2.5% |
| N Illinois | 4.7 | 3.3 | 6.7 | 5.3 | 67.1% | 9.0% | 1.0% |
| Ball State | 3.8 | 4.2 | 6.0 | 6.0 | 57.7% | 4.9% | 0.5% |
| Central Mich | 3.4 | 4.6 | 5.2 | 6.8 | 47.6% | 4.2% | 0.4% |
| E Michigan | 2.7 | 5.3 | 4.1 | 7.9 | 32.3% | 2.0% | 0.1% |
Mountain West Preseason Predictions 2017
| MWC | Conference | Overall | Playoffs | ||||
|---|---|---|---|---|---|---|---|
| Mountain | W | L | W | L | Bowl Eligible | Win Conf | Undef |
| Boise State | 6.1 | 1.9 | 8.4 | 3.6 | 84.9% | 26.3% | 4.1% |
| Colorado St | 5.5 | 2.5 | 7.4 | 4.6 | 76.9% | 14.6% | 0.7% |
| Utah State | 4.2 | 3.8 | 5.9 | 6.1 | 56.1% | 6.6% | 0.5% |
| Wyoming | 4.2 | 3.8 | 6.5 | 5.5 | 65.5% | 5.0% | 0.7% |
| Air Force | 3.8 | 4.2 | 5.4 | 6.6 | 50.5% | 4.3% | 0.3% |
| New Mexico | 3.2 | 4.8 | 5.4 | 6.6 | 49.5% | 2.8% | 0.2% |
| West | W | L | W | L | Bowl Eligible | Win Conf | Undef |
| San Diego St | 6.3 | 1.7 | 8.8 | 3.2 | 89.2% | 28.6% | 4.7% |
| UNLV | 3.2 | 4.8 | 4.9 | 7.1 | 42.0% | 2.9% | 0.1% |
| Nevada | 3.0 | 5.0 | 4.3 | 7.7 | 30.9% | 2.4% | 0.1% |
| San Jose St | 2.8 | 5.2 | 4.0 | 9.0 | 29.2% | 2.2% | 0.0% |
| Hawaii | 2.8 | 5.2 | 4.4 | 7.6 | 37.4% | 2.4% | 0.2% |
| Fresno St | 2.8 | 5.2 | 3.9 | 8.1 | 25.6% | 1.9% | 0.0% |
Sun Belt Preseason Predictions 2017
| Sun Belt | Conference | Overall | Playoffs | ||||
|---|---|---|---|---|---|---|---|
| Team | W | L | W | L | Bowl Eligible | Win Conf | Undef |
| App State | 7.0 | 1.0 | 9.6 | 2.4 | 95.3% | 37.1% | 7.2% |
| Troy | 6.4 | 1.6 | 8.4 | 3.6 | 88.6% | 22.0% | 1.5% |
| Arkansas St | 5.3 | 2.7 | 7.0 | 5.0 | 71.9% | 11.2% | 1.1% |
| GA Southern | 4.9 | 3.1 | 6.8 | 5.2 | 69.9% | 9.4% | 0.4% |
| LA Lafayette | 4.2 | 3.8 | 5.4 | 6.6 | 47.9% | 4.5% | 0.1% |
| LA Monroe | 3.7 | 4.3 | 4.2 | 7.8 | 31.6% | 4.7% | 0.0% |
| Georgia State | 3.3 | 4.7 | 4.9 | 7.1 | 41.6% | 3.4% | 0.1% |
| S Alabama | 3.3 | 4.7 | 4.5 | 7.5 | 35.1% | 2.0% | 0.1% |
| Coastal Car | 3.3 | 4.7 | 5.3 | 6.7 | 0.0% | 2.7% | 0.2% |
| Idaho | 3.1 | 4.9 | 4.5 | 7.5 | 36.5% | 2.3% | 0.1% |
| N Mex State | 1.8 | 6.2 | 2.4 | 9.6 | 11.3% | 0.4% | 0.0% |
| Texas State | 1.7 | 6.3 | 2.7 | 9.3 | 13.3% | 0.3% | 0.0% |
Independent Preseason Predictions 2017
| Ind. I-A | Conference | Overall | Playoffs | ||||
|---|---|---|---|---|---|---|---|
| Team | W | L | W | L | Bowl Eligible | Win Conf | Undef |
| BYU | — | — | 8.4 | 4.6 | 86.2% | — | — |
| Army | — | — | 7.5 | 4.5 | 79.5% | — | — |
| Notre Dame | — | — | 7.4 | 4.6 | 75.2% | — | — |
| U Mass | — | — | 3.5 | 8.5 | 21.2% | — | — |
How We Make Preseason Predictions
As we noted in our 2017 college football preseason rankings blog post, we have identified a set of team-level metrics that have demonstrated predictive value for projecting a team’s upcoming season results.
We identified these metrics by reviewing about a decade’s worth of college football data and applying significance tests to any interesting looking findings. Then, we built an algorithmic model that takes in these metrics as inputs, and computes a numerical preseason power rating for all 130 FBS teams.
A team’s preseason power rating signifies how good we think it will be this coming season. Figuring out precisely how many games we expect that team to win, however, is a much more complicated problem.
To do that, we run thousands of game-by-game computer simulations of the 2017 college football season, using our predictive ratings to come up with implied win odds for each game.
Thanks to randomness, each season simulation plays out differently. Occasionally an unheralded team like Texas Tech or Arizona gets lucky, makes a run and wins its conference.
Over thousands of simulation runs, though, trends in the results begin to emerge. The 2017 preseason college football predictions in this post represent the averages of all the season simulation runs we conducted.
Exactly What Do These Numbers Mean?
It’s important to understand how our system generates the results it does, and precisely what they mean.
Here are the key details:
We end up projecting a lot of fractional wins. That obviously can’t happen in real life, but we don’t want to reduce precision in the numbers just to make them look prettier. For example, a projected 7.6 win team has worse prospects than a projected 8.4 win team. If we rounded, they’d look the same (8 wins each).Even if we project a team with X wins, it doesn’t necessarily mean we’re highly confident they’ll end up with that exact number. Let’s say we project a team with exactly 7 wins. In our season simulations, 7 wins may have been the most common outcome, but that team may have ended up with 6 or 8 wins nearly as often, and likely even hit 5 or 10 wins some of the time. Our final projection, since it’s an average of all those numbers, ends up at 7 wins — but the odds of the team ending up with exactly 7 wins could still be as low as 15-20% or so.Projections can change slightly day-to-day, even with no new game results. Because we re-simulate the season every day, randomness in simulation results may cause slight fluctuations in team projections from one day to the next, even if no new games have been played. So it’s wise not to read too much into tiny differences in the projections. A 0.1% difference in conference champion odds between two teams, for example, is not significant.
Why Is A Simulation-Driven Approach Valuable?
Despite some of the limitations, our data- and simulation-driven approach to making preseason predictions has proven to be a lot more accurate than the alternatives.
Human college football “experts” (some of them, at least) can be decent at projecting the future performance level of a team — especially one they’ve studied closely. But on the whole, they tend to have a very poor grasp of the potential impacts of probability and randomness over the course of a full college football season.
For example, even skilled “football people” tend to underestimate a great team’s odds of losing to a mediocre or bad team. While it’s true that a team like Ohio State is very unlikely to lose to a team like Rutgers, upsets do happen, and those probabilities keep adding up game after game. So you can’t discount them, especially when conference championships can be decided by just one win.
Running thousands of simulations to directly observe the distribution of outcomes generated by all the probabilities at play is a much more objective and precise way to do things.
When the dust settles at the end of the season, our preseason projections will almost certainly be way off for a few teams. As happens every year, some teams simply defy expectations, while other projections will be derailed by injuries, suspensions and other unexpected events that occur as the season goes on.
Our goal is the overall accuracy of the entire system, though — every prediction for every team. By that measure, our methodology has proven very tough to beat.
If you liked this post, please share it. Thank you! Twitter Facebook
NFL Football Pool Picks NFL Survivor Pool Picks NCAA Bracket Picks College Bowl Pool Picks College Football Pool Picks NFL Picks NBA Picks MLB Picks College Football Picks College Basketball Picks NFL Predictions NBA Predictions MLB Predictions College Football Predictions College Basketball Predictions NFL Spread Picks NBA Spread Picks MLB Spread Picks College Football Spread Picks College Basketball Spread Picks NFL Rankings NBA Rankings MLB Rankings College Football Rankings College Basketball Rankings NFL Stats NBA Stats MLB Stats College Football Stats College Basketball Stats NFL Odds NBA Odds MLB Odds College Football Odds College Basketball Odds A product ofTeamRankings BlogAboutTeamJobsContact
© 2005-2024 Team Rankings, LLC. All Rights Reserved. Statistical data provided by Gracenote.
TeamRankings.com is not affiliated with the National Collegiate Athletic Association (NCAA®) or March Madness Athletic Association, neither of which has supplied, reviewed, approved or endorsed the material on this site. TeamRankings.com is solely responsible for this site but makes no guarantee about the accuracy or completeness of the information herein.
Terms of ServicePrivacy Policy